Your Creative Partner In Every Pixel

Your Creative Partner In Every Pixel

Social media analytics dashboard showing total views, follower and non-follower percentages, and content type distribution for a 30-day period.
A social media analytics dashboard showing views of 609,938 over a period from April 8 to July 6, with pie chart data indicating 70.5% followers and 29.5% non-followers. Additional metrics include accounts reached, which is 43,923 with a 79.3% increase, and engagement breakdown by content type, including stories, posts, reels, and videos.
Social media analytics dashboard showing total views of 150,337 from March 29 to April 27. Pie chart indicates 75.3% followers and 24.7% non-followers. Additional metrics include accounts reached, content type breakdown, stories, posts, reels, and videos.
Gold earring with embedded diamonds resting on a rock with black and white patterns.
Gold jewelry with butterfly and floral designs, placed on seashells against a textured surface.
Close-up of a gold ring encrusted with numerous small sparkling diamonds, resting on a textured woven surface.
Screenshot of a professional dashboard showing insights from June 7 to July 6, including views, interactions, new followers, and shared content.
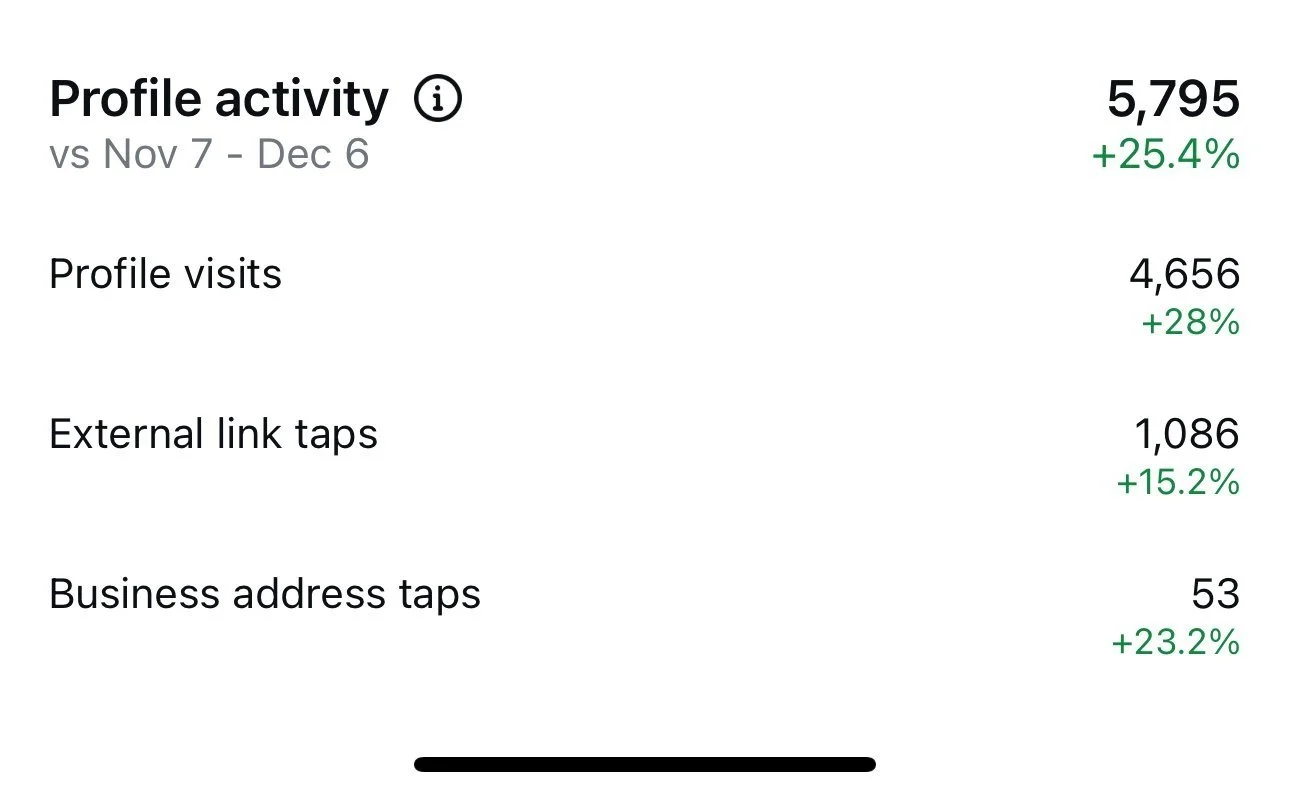
A digital dashboard displaying profile activity statistics, including total activity, profile visits, external link taps, and business address taps, with percentage changes from previous data.
Screenshot of a professional dashboard showing 1.2 million views in the last 30 days, with buttons labeled Edit profile, Share profile, and Contact.
A digital analytics dashboard showing profile activity data from March 6 to April 4, including total profile visits, external link taps, and business address taps with respective counts and percentage increases.
A digital professional dashboard showing a heading, view count in the last 30 days, and buttons for editing and sharing the profile.
Screenshot of a professional dashboard with options to edit profile, share profile, and contact.
Social media analytics displaying profile activity data from December 23 to December 29, including total interactions, visits, external links, and business address taps with percentage increases.
Screenshot of a mobile app displaying profile activity data for a week, including total profile visits, external link taps, and business address taps, with percentage growth indicators.